Energy Accounting
🎯 Objectives & Structure
The Energy Accounting product helps customers visualise their energy usage with a specific focus on their impact on the network by highlighting their offtake and injection figures and putting them in perspective with the financial impact.
The purpose of each sheet within the app is described in the related documentation, as well as an overview of the main graphs and tables that are available on those sheets.
🛠️ Common Features
✂️ Filters
Most screens of the dashboard enable users to use filters that will be applied to all the graphs that are available.
The top row provides a series of pre-selected filters. To apply a filter to the data, click on the name of the filter and select the value(s) you wish to filter on. After clicking the checkmark, the data will be displayed based on the selected filter(s).

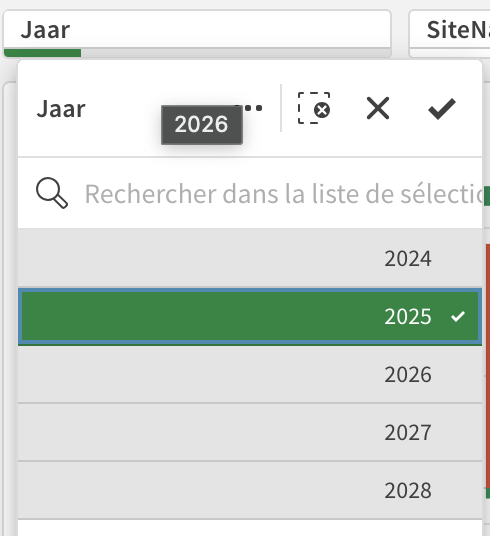
When one or more filters are applied to data, those will be displayed in the header of the page. You can dismiss active filters by clicking on the cross.

🔍 Drill Down
The data shown on many graphs can be drilled down to show more details.
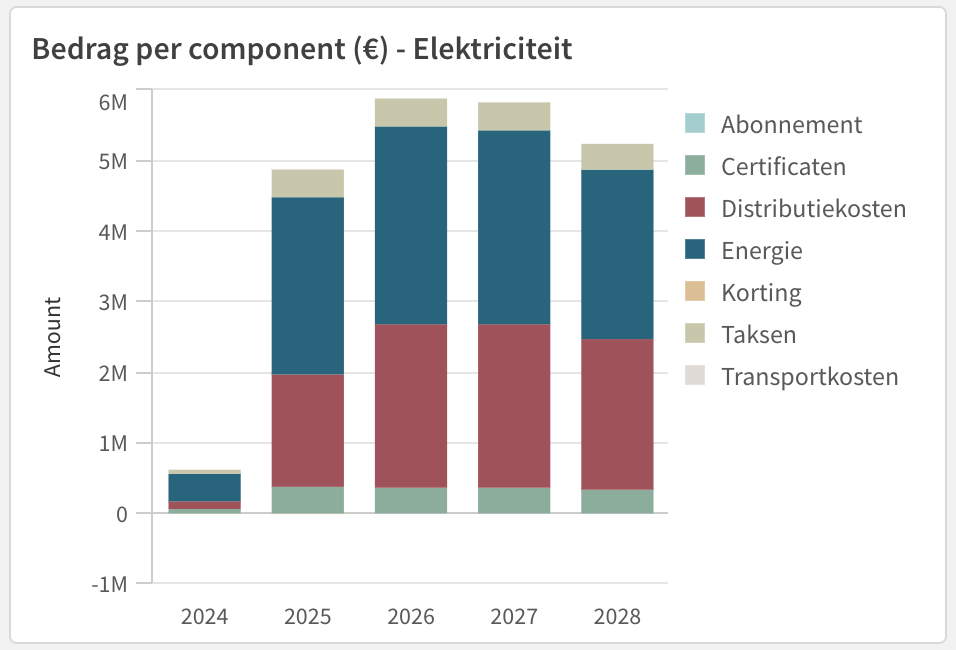
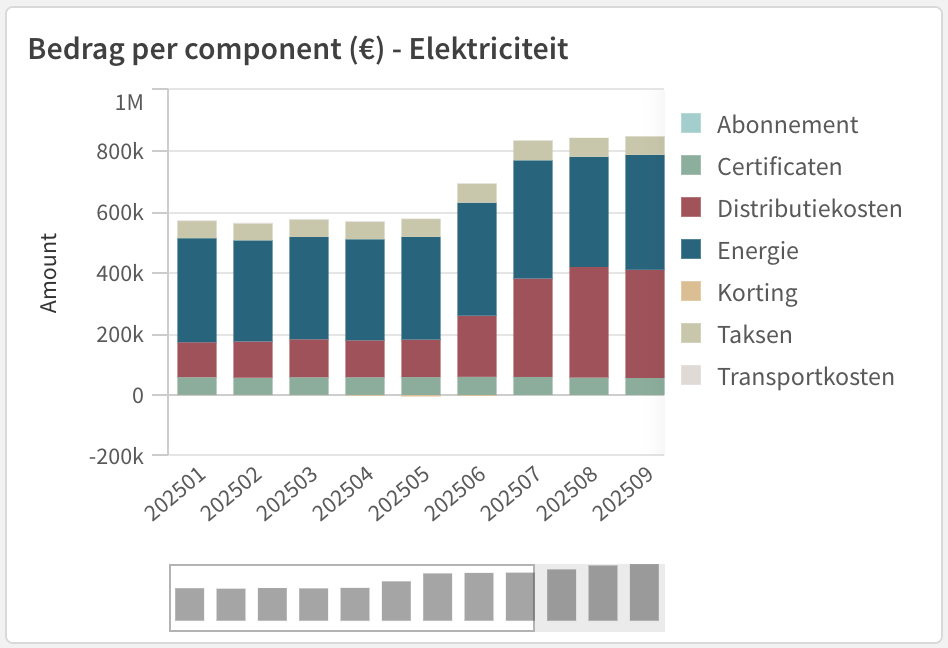
To drill down data based on a specific dimension (time, quality, etc), click on a specific part of the graph. The data will then be drilled down and the display will be adjusted based on the new dimension.
Example: Default / Drilled Down 2025
🖥️ Screens
⭐️ Premium
Configuration Offtake & Injection MWh
Carbon Market Data Electricity Market Data Gas Invoice Details